
Disclaimer: I am a consultant at Amazon Web Services, and this is my personal blog. The opinions expressed here are solely mine and do not reflect the views of Amazon Web Services (AWS). Any statements made should not be considered official endorsements or statements by AWS.
In the world of serverless computing, choosing the right memory configuration for your AWS Lambda functions is crucial for optimal performance and cost-efficiency. Determining the ideal memory allocation requires careful consideration and understanding of your application's requirements. By properly sizing the memory, you can ensure that your Lambda functions have the necessary resources to handle their workload effectively.
Optimizing memory for your Lambda functions is one of the important things you should know. This helps you in both - performance as well as cost optimization. You can save a good amount of money by reducing the allocated memory to over-provisioned Lambda functions.
In this post, I will show you one of the ways to determine the right memory for your Lambda Function.
This approach makes use of Amazon CloudWatch logs. So, make sure the Lambda execution role has enough permission to send logs to Amazon CloudWatch.
In the first step, you just need to invoke your Lambda Function multiple times, say 10 times, 50 times, 100 times or more. These executions will generate logs in Amazon CloudWatch, which will be used in further steps.
To invoke your Lambda Function multiple times, you can use any approach from the following:
or any other way that you are comfortable with.
Amazon CloudWatch Logs Insights allows you to search and analyze your log data stored in Amazon CloudWatch Logs. You can perform queries to efficiently and effectively analyze log data for specific use cases.
Example of most common use cases:
- Lambda: View latency statistics for 5-minute intervals
- Lambda: Determine the amount of overprovisioned memory
- Lambda: Find the most expensive requests
- VPC Flow Logs: Top 20 source IP addresses with highest number of rejected requests
- Common queries: Number of exceptions logged every 5 minutes
- Common queries: 25 most recently added log events
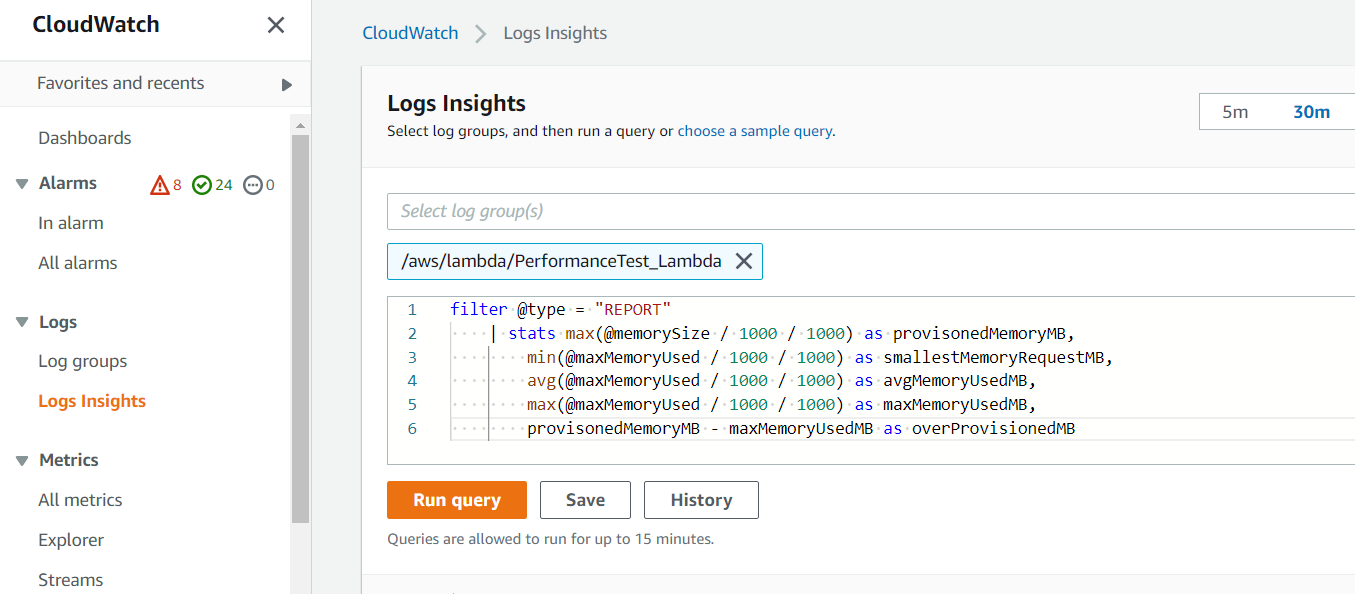
Follow the below easy steps to run a query in Amazon CloudWatch Logs Insights.
filter @type = "REPORT"
      | stats max(@memorySize / 1000 / 1000) as provisonedMemoryMB,
          min(@maxMemoryUsed / 1000 / 1000) as smallestMemoryRequestMB,
          avg(@maxMemoryUsed / 1000 / 1000) as avgMemoryUsedMB,
          max(@maxMemoryUsed / 1000 / 1000) as maxMemoryUsedMB,
          provisonedMemoryMB - maxMemoryUsedMB as overProvisionedMB
Here is a screenshot with the above query:
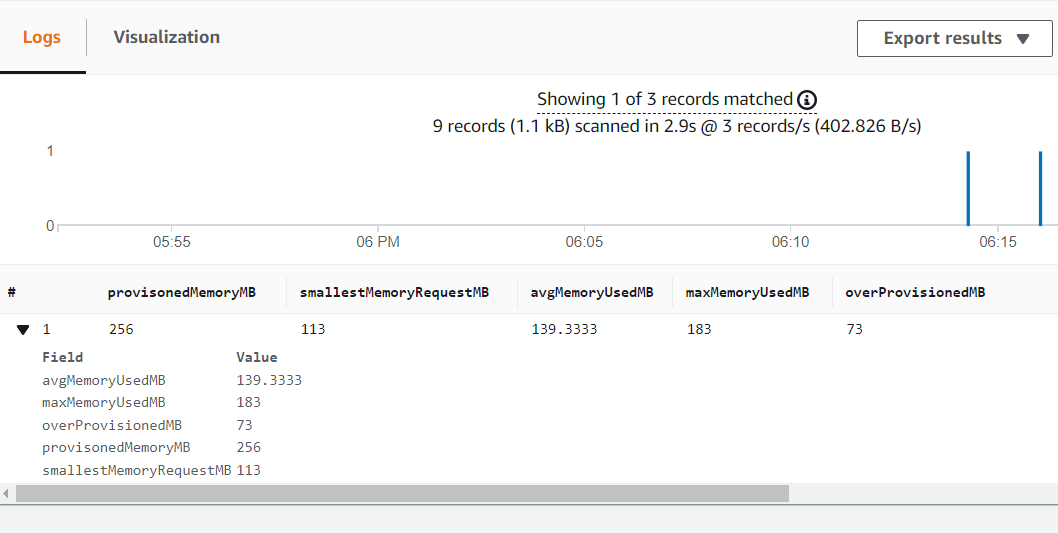
After running the above query in Amazon CloudWatch Logs Insights, you will get the result below. This result will provide you with numbers for the below parameters:
With the help of the above parameters, you can easily decide how much memory would be required for your Lambda Function to run efficiently. To be on the safe side, you should always provision some extra memory.
In this post, you learned how can you determine the right memory for your Lambda function using Amazon CloudWatch Logs Insights. Please let me know your thoughts and feedback in the comment section below.
Thank You ❤️